States machines are everywhere, used in all programming languages. Some people are fond of them, and others hate them. They may be easy to read or very cryptic, and most of the time they are not easy to debug. I will show you today how to improve this last point in your code.
The Bad First Impression
For a very long time, I was part of the developers that hated FSM. This was mainly due to my first experience with a - real world - state machine that occurred during the first months of my professional life: Imagine the GUI of the whole Android or iOS system implemented as a - very - big, unique, finite state machine. This was the application code of an operating system done in this company. This code had all sins of bad state machines:
- I was in production since some time, so a lot of developers had been working on it, sometime with evidence that they did not understand what they did.
- There was no more maintained documentation, but who would maintain a documentation of several 100th of states?
- Many transitions bypassed the transition system of the framework. So the code almost exclusively consisted of \"if else\" statements.
- The whole context was defined as global variables.
Fortunately, I could stay away from that code and I only had to get into in for rare (but painful) debug occasions. I was working on the driver team and we only had to fight with the beast when bugs where reproduced only with the application.
As a consequence, for a very long time, I designed all my code so that state machines were not needed. So almost all my code was stateless. This was obviously not satisfying. There was always some state machine logic at strategic locations to trigger the equivalent of state changes. At some time, I was ready to re-consider using state machines, providing that they can be implemented with readable and maintainable code. More specifically, my requirements for a state machine are:
- Avoid states and transitions code duplications.
- Be easy to read and understand.
- Stay reasonably small.
Code duplication is something unavoidable with simple state machines. If two states are very similar, they are duplicated instead of having common code for their common behavior. Making this worse, there are often many very similar states in a state machine, leading to many code duplications.
To stay readable, the states and events just have to be called without having to write tons of if/else statements or filling cryptic transition arrays.
Finally the reasonably small requirement is subjective. The same principle than in programming apply here: When the code is two big, then it should be split in several parts.
All of these point are solved with one kind of state machine: Hierarchical State Machines (or StateCharts). When I discovered them in this article I started to change my mind on state machines, and started to use them again. They are the solution to inherit behavior between states, hence reducing code duplication.
The FSM Debug Headache
Using a HSM instead of a basic state machine is a big improvement for the code readability and maintenance. For more information on how to make them easy to read in modern C++ code, see this very good article.
However, the debug issue is still the same. There is now some event-driven code, fully asynchronous, and the most basic debug tool is most of the time the only available one: logs. Difficulties to debug state machine do not occur at the beginning: Unit tests, integration test, with some steps in the debugger allows to get some code up to production easily. The problem is when the validation team or field testers report some issues with complex reproduction steps. When the only debug tools are the logs, then there is rapidly more than 1000 lines of text log containing the root of the issue to analyze. This is even more difficult to analyze when these logs concern several instances of the same state machine. Following the states of a single instance is a real pain and can take hours before understanding where the issue come from.
Visual Debugging
So how can we improve the analysis of these log? I tough about several ways to improve the situation, involving visualization, and finally ended up to a very simple solution: scatter plots. This new tool is the second one of the edKit toolkit, and is named edVent. Before detailing how it works, here is how it looks like:
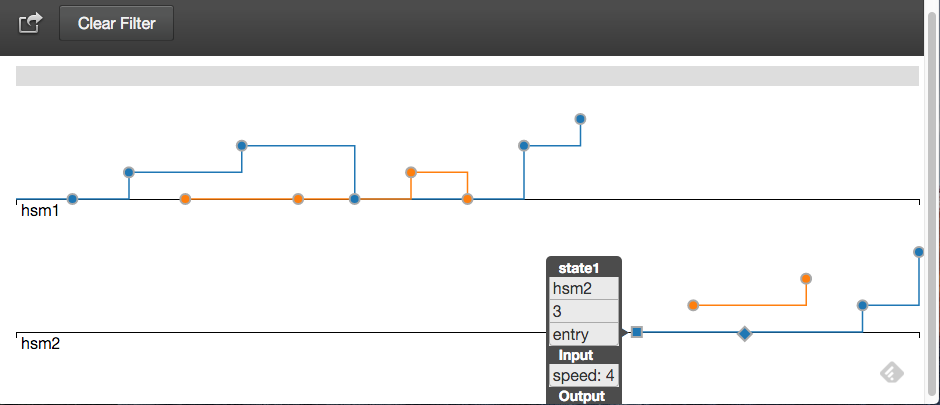
This is a plot from a very simple example, but it show most features of the tool: There are two state machines (hsm1 and hsm2) and each one has two instances. The X axis represents the events chronology (i.e. left is the oldest event and right the most recent). The Y axis represents the current state. The first debug facility of eVent is that each instance of a state machine has a dedicated color and all of its events are linked via a line together. This allows to immediately see what is the current state of each instance, and follow the events history for each instance. Moreover, it is possible to zoom the plot. This makes the navigation easier when there are many events.
The second facility is the tooltip that appears when moving the mouse over an event. It prints all attributes associated to the event. The complete list will be detailed later, but on the example one can see that the current event is the entry to state1 of the instance 3 of hsm2. Moreover, the event has an input attribute speed with value 4.
The third facility is that several types of events are displayed in a different way. Events are displayed as circles, but you can also log entry and exit of functions. Entry events are displayed a squares, end exit events are displayed as diamonds.
Finally there is another very interesting feature when you have a real dataset: Event filtering. Event filtering allows to display only the events of the selected object instance, AND its associated objects. An associated object is another object that has been marked as linked to it. Suppose that you have a FSM A that by composition uses objects B and C, then clicking on an event of A, you will only see the events of A, B, and C corresponding to the instance of the event. So if you have 10 instances of A, this allows to remove the visual noise of all other instances. You can reset the event filtering by clicking on the Clear Filter button.
How To Use It
The input of edVent is a JSON file containing an array of log entries. The structure of a log entry is the following:
{
  "t": "iso8601 date",
  "class":"string",
  "method":"string",
  "obj":"string",
  "type":"string",
  "data_in":{object},
  "data_out":{object}
}
This is a generic specification for structured logs. So a log entry looks like this:
{ "t" : "0", "class" : "hsm1", "method" : "state2", "obj" : "1", "type" : "event", "data_in" : {} }
t is the timestamp of the event. This information is not used for the moment.
The class/method/obj triplet allows to identify an object. It important to note that this allows to log not only state machines events, but virtually any code. The obj field identifies the instance of the object (or state machine). This identifier must be unique per object in the whole log. So if you have different objects with the same identifier in a log, you must take care to prefix them. This restriction allows some tricks to ease debugging (see bellow for more on this).
The type field identifies the event type (event,entry,exit,link). A link entry allows declare parent/child relation between objects. A link entry must have a child data_in field. For example, here is how to declare that object 1 depends on object 2;
{ "t" : "0", "class" : "hsm1", "method" : "state3", "obj" : "1", "type" : "link", "data_in" : {"child": "2"} }
The data_in field contains the list of input attributes/parameters of the event and the data_out field the list of output attributes/parameters. Since this is a json object, any key/value information can be provided here. The only restriction is that the value cannot be an object, but only a base type.
This generic structure should allow to trace any kind of event, depending on how you choose to map class/method/obj. In the previous example the class is mapped to the state machine name, the method is mapped to the event name, and obj to the state machine instance. This is a mapping that seems to work well to debug state machines. However, this structure is probably not the one that exists in your code.
For example, if you use the boost statechart library, your state machine class does not handle any events, this is done in the state classes. In this case you do not want to map each state class as an edvent class. The following mapping is more relevant:
- Map the same edVent class for the boost state machine class and all event classes.
- Map one edVent method per react prototype (for all the states).
- Map the object as outermost_context(), i.e. the state machine instance.
By doing this you can follow all events of the state machine in a single plot. In order to know the current state when each event was triggered, you can add a state data_in attribute containing the name of the state that caught the event.
Another interesting trick comes from the fact that obj must be unique to the whole log, and not only to the associated class. This allows to expose the same object in different edvent classes. For example, if you follow the previous mapping, you cannot easily see the history of the state changes. In this case you can also expose another edVent class, with the same obj identifier:
- Map a new class : MyStateMachine.state.
- Map the same edVent obj than previously.
- Map the edVent method to the entry state name when changing state.
With this you will have one plot that allows to follow the state changes, and another one that allows to follow the events.
Next Steps
edVent is available right now on github. Feel free to use it and provide feedback. There are many other things that could be done from these structured logs in the future:
- Outlier detection: This would allow to automatically detect errors in endurance tests.
- time machine: It should be possible to display the state machine, its current state, and travel in time to see its evolution.
- native client: I will probably write a native client to easily log these events, and send them via a network connection for real-time monitoring.
Romain.