edKit development has just started. edKit is a set of tools to help debugging software. It is especially dedicated to embedded environment where big tools such as valgrind are not applicable or simply not available.
The two main objectives of this project are: simple and efficient. The project is written in C++ and has only few dependencies:
- posix threading : threads and mutex support.
- C++ basic support (no exceptions, no use of libstdc++ classes).
- LD_PRELOAD support.
This post is a focus on the simple part of edleak. edleak is the edKit tool dedicated to memory leak detection.
Hooking memory allocations
Edleak is a shared library that is hooking memory allocation functions. these hooks are using the LD_PRELOAD environment variable. The following functions are hooked:
- malloc, calloc, realloc, valloc.
- new, new (std::nothrow), new[].
- delete, free.
For each allocated data, the immediate caller is saved as the execution context (ExeContext). Most tools save the whole backtrace for each allocation which requires a lot of memory to store them. This simpler way to manage the execution context saves memory while keeping efficiency: With little knowledge of the code you easily find conditions where a leak occurs based only on the allocation point. Each context has the following attributes: allocation instruction address, allocated size, and a friendly name (i.e. a name guessed from the symbol table). These contexts are saved in a list to access them (This should be replaced with a hash table for faster lookup).
Minimizing overhead
The memory structure of edleak is shown on the following figure:
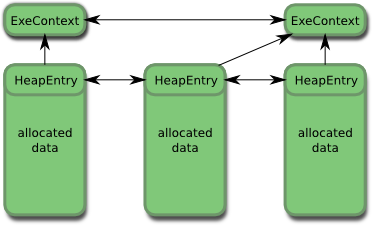
The overhead applied to each allocation is minimal because the size of HeapEntry is 24 bytes, and the size of ExeContext is 88 bytes. This means that the memory overhead is 24 bytes for each allocation, plus 88 bytes for each context i.e. each allocation point.
As you can see, the HeapEntry storage is placed at the beginning of each allocated space. This is done by allocating more memory than requested which allows to immediately find the HeapEntry when freeing the memory, and avoids an allocation.
Memory leak detection
The edleak library does not detect memory leaks directly. It is just doing snapshots of all context at a given period. A FileWriter thread is dedicated to this task. This thread is writing contexts snapshots (slices) on a file, as json data. So you just run your target software with edleak preloaded, and wait for the logs. After everal minutes/hours you have a json file of several megabytes with tens/thousands of slices that must be analyzed to detect potential memory leaks. This task is done with another tool that will be described in details in another post.
Just try it
A first code drop is available on github. you can already try it before the next article that will explain why edleak is very efficient in detecting memory leaks.