EdLeak visualization tools greatly help to find memory leaks. However they still require a manual analysis so that the culprits are discovered. Let's see how memory leaks may be found automatically.
Automating memory leak detection
The idea of an implementable automated memory leak detection came after reading this post from Brendan D. Gregg : If the memory usage of a process is tracked during a long enough period of time and this can be modeled to extract a leak factor, then it should be possible to automatically detect leakers.
A Leak Factor
So the question is how can a memory usage over time can be modeled so that something like a leak factor is associated to it ? In other words, what information is needed to tell if a leak occurred or not, and for what quantity ?
At first it may seem that the two information are fully correlated : A leak obviously happened if we lost some memory right ? Unfortunately it is not that simple : It is possible that when the memory usage was monitored, an object was allocated at a point of time and that it will be fred later, or during the cleanup of the program. If this is a big object then such a simplistic method would badly detect a big leak. Another typical use-case is a cache that is being filled : Simply detecting memory loss will end-up in false positive leak detections (A previous post explained how to detect them with edLeak). So when memory was lost, we need to classify the loss to determine if this is a leak or a cache filling.
The second part of the question is easier to answer : Once we know that a leak occurred, we need the leak size in byte, so that we can sort leaks by size.
So the leak factor can be composed of two information : The leak classification and the leak size. If these two information are available for each allocation point of a program, then automated leak detection can be done.
Computing the leak factor
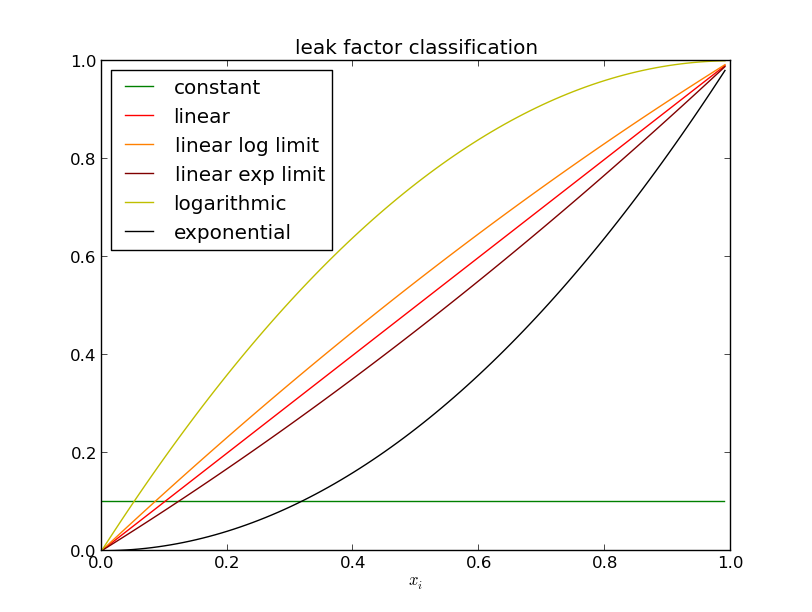
Now that the leak factor is specified, let's see how to compute it. The following classification values can be considered :
- Constant.
- Linear.
- Logarithmic.
- Exponential.
Such values should allow to classify the leaks by priority: A constant entry does not leak, a linear entry leaks regularily, a logarithmic entry is probably a cache that is being filled, and an exponential entry is a critical leak (something that probably leaks containers of objects). These classification names are a good hint on how they can be determined from a memory usage capture : They are can all be modeled as a polynomial. If the memory usage of an allocation point is modeled as a second order polynomial, then the classification can be determined from its coefficients.
Using a second order polynomial should match the behaviors that we want to model without loosing important information. A first order polynomial would not allow to detect cache fillings (logarithmic curves), and a higher order would not bring additional valuable information. The Polynomial regression of the scatter plot capture can be done with the linear least-squares method. This can be done with a few lines of python thanks to the linear algebra functions of scipy. For now arbitrary coefficients where chosen as shown on the following diagram. These coefficients may be adjusted based on future experiments.
As shown on this diagram, the scatter plot is normalized before the polynomial regression. This is necessary to allow comparing all allocations points and memory usage runs. Once the polynomial coefficients are available, the leak size can be estimated by scaling the polynomial leak size (i.e. scaling the ordinate value at abscissa 0.0 and 1.0 to the scale of the memory usage).
So the steps to compute the leak factor are the following:
- Normalization.
- Polynomial regression.
- classification.
- leak size etimation.
Application with edLeak
The leak factor of all allocation points is automatically computed when the asset is generated. It is available in the leak_factor field of each allocation point :
allocers = asset.getAllocerList()
allocers[21]['leak_factor']
{'class': 'linear',
 'coef': [-0.030319879363351707, 0.9684086019444907, 0.017054468535166723],
 'leak': 15009,
 'max_size': 18000.0,
 'min_size': 2000.0}
The leakers can then be sorted quite easily. For example the leakers can be printed from the highest to the lowest leak size :
sorted_allocers = sorted(allocers, key=lambda allocer: allocer['leak_factor']['leak'], reverse=True)
for sorted_allocer in sorted_allocers:
    print sorted_allocer['leak_factor']['leak']
15009
7477
1499
150
75
29
3
3
0
0
...
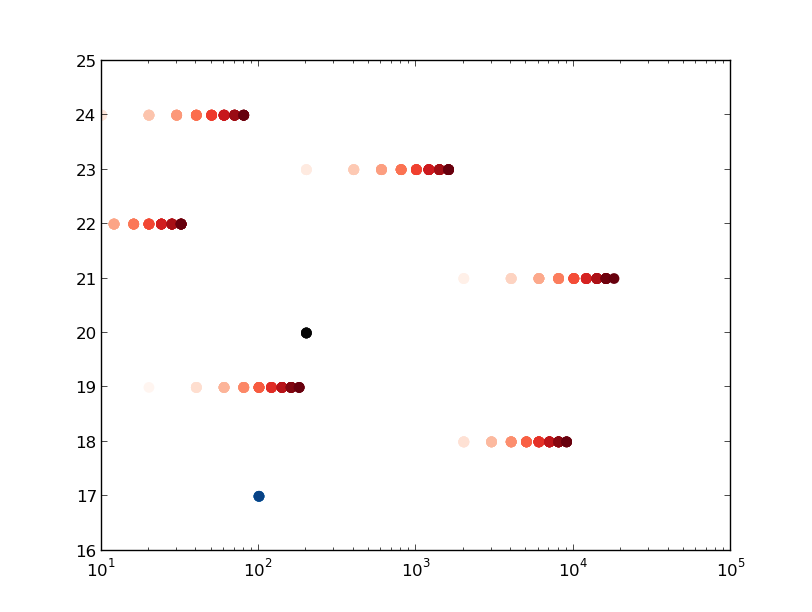
Also all allocation point that did not leak can be removed from the list before plotting the leakers:
leakers = [l for l in allocers if l['leak_factor']['leak'] != 0]
elplot = edleak.plot.SlicePlotter(asset)
elplot.sizePlot(allocers=leakers)
This give the following graph with a slice run of the leaker test executable:
Next Steps
The next steps will probably be to adjust the classification coefficient values and make the sorting of leakers easier. However the current state should already allow to automatically remove most allocation points that did not leak during a slice run.