The first edKit post explained how to run edleak. Now you have slices that where dumped for 8 hours and you want to know if there is any memory leak. This task is done by the most efficient tool for visual analysis: Your eye.
So as you probably already guessed, the slices analysis is done via data visualization: An html application is used to read edleak slice files and display them. Data are displayed in a scatter plot, encoding 3 dimensions :
- abscissa represents the memory size.
- ordinate represents the execution context (code address and symbol name if available).
- The points color encodes time: Gray is the start time of the measure, dark green the end of the measure.
The analysis application is pretty simple in itself since it relies on Protovis for drawing the scatter plot. Loading the generated json slice file is done with html5 FileReader.
Now let's see how to detect memory leaks within fractions of a second with such a scatter plot.
Memory leak
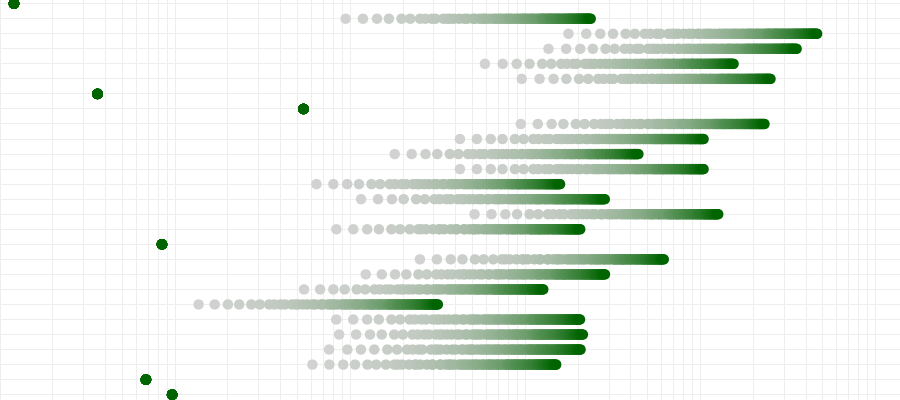
When scrolling through the graph you will see mostly green points. These represents the execution contexts where memory consumption did not change over time (or changed very little). A memory leak is identified via a gray to green gradient line:

Here we have a very regular and linear leak.
Small memory leak
But there are some cases where the gradient does not appear as easily: If there are big allocations sizes in the slices, small memory leaks will not appear clearly:


The leak is now easily detected even if it is very small compared to other allocations size.
A spray is not always a leak
However you still have to think before considering any gradient line as a memory leak. The following line for example is suspicious:

However this is not a memory leak. The memory consumption grows quickly on the begining (there are a lot of gray points). Then the consumption is stabilizing (green points are near each other). This is a cache that is being filled during the beginning, and then stops growing once it is full. If the measure was longer there may be dark green points in the middle of the line when the cache is freeing some memory.
dependency Leaks
The scatter plot may also contain frightening lines in it:
Once again some reflexion is needed before considering that there are more than 20 memory leaks on this graph. There is only one leak in a C++ code : One method is leaking a C++ object that allocates other objects. This leads to such cascading sprays. Find the root leak, and all other sprays disappear.
That's all for this time. I hope this article will incite you to test edKit and help in your debugging sessions.